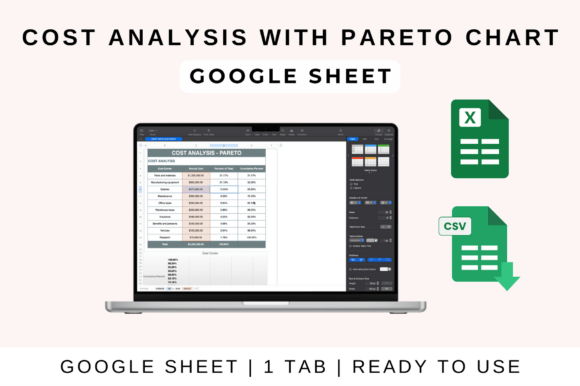
Cost Analysis with Pareto Chart: Visualizing Impact
In the realm of graphic design, every decision carries a cost—whether in time, resources, or budget. The Cost Analysis with Pareto Chart template is a powerful visual tool that applies the 80/20 rule to your expenses, instantly highlighting which 20% of factors are responsible for 80% of your total costs. This isn't just a financial spreadsheet; it's a strategic asset for designers and creatives seeking to allocate resources wisely, prioritize impactful spending, and communicate financial data with striking clarity.
Why This Visual Tool Matters for Design Professionals
Effective design is about more than aesthetics; it's about solving problems and communicating information efficiently. A Pareto chart achieves this by transforming complex cost data into an immediate, visual story. For a branding project, it can reveal if custom typography or a specific color palette is consuming the majority of the budget. In digital marketing, it can show which social media graphics or ad formats deliver the most value relative to their cost. This template empowers you to make data-driven decisions that strengthen your brand identity and optimize your creative workflow.
Practical Applications Across Creative Projects
Integrate this cost analysis method into various facets of your work to enhance both process and outcome:
- Branding & Logo Design: Analyze if investment in multiple logo variations or extensive market research aligns with the project's core goals.
- Marketing Materials & Advertising: Determine which print design formats or digital ad campaigns generate the highest engagement relative to production cost.
- Web & UI/UX Design: Identify if complex custom illustrations or high-end stock imagery are the primary cost drivers in a website build.
- Packaging & Editorial Design: Visualize whether specialty printing techniques, paper stocks, or licensing fees are consuming the largest portion of the budget.
- Presentation & Digital Products: Ensure resources are focused on elements that most significantly enhance user experience and professional presentation.
Tips for Effective Use and Design Integration
To maximize the template's value, think of it as part of your design system. Ensure consistency by aligning the chart's color palette and typography with your brand's visual language. Use it to establish a clear visual hierarchy in your financial reports, making the most critical cost drivers immediately apparent. Evaluate your expenses not just for their monetary cost, but for their contribution to the project's overall visual impact and communication goals. The built-in formulas and compatibility with Google Sheets and Excel make it a seamless addition to your existing toolkit.
Ultimately, thoughtful resource allocation is a hallmark of professional design. By leveraging a tool like the Cost Analysis with Pareto Chart, you move beyond guesswork. You gain the insight to invest in creative assets that truly elevate your work—whether it's a stunning color palette, flawless typography, or a compelling layout—ensuring every dollar spent contributes meaningfully to a polished, effective, and communicative final product.